urMQTT on a real ARM64 VPS: no screen, no hardware random number generator, and a handshake that was too slow
What happened after the v0.3.0 text: the first run on a real aarch64 KVM server (install on its disk, a power cut, disk figures), a Diagnostic entry that reports over the network because the console is invisible, what it found about the random number generator, a P-256 assembly for ARM64 that made full handshakes about 1.5 times more frequent, and the mistakes we made on the way.
The previous text, urMQTT v0.3.0, ended with four items under "What comes next": a decision on the public demo broker (D1), fuzzing of the PCI and virtio parsers and a test for the locked page tables, a key dialog on the builder page, and bare metal. None of the four was done in this round, and we say so first. What we did instead is the thing that was missing all along: we ran urMQTT on a real ARM64 server under KVM, and almost everything below comes from that one machine. The first item of the old list, CI, was cleaned up (the earlier text and the release notes that called it red were corrected).
The note up front stays the same: the project is pre-alpha, the numbers measure code, tests and specific experiments on one machine, not maturity in production. Where a figure was not measured on the target machine, it says so.
How it looked over time
From the last text (3 November, 02:43) to today (4 November, 03:18) main has 29 new commits, 244 in all. As before, the project is built with Claude Code (commits carry Co-Authored-By: Claude). The numbers are computed with the method of the last two texts (all .rs files outside vendor/ and fuzz/, #[test] functions, ## ADR- headings in docs/DECISIONS.md); the method gives the same figures as then on the old commit.
| Moment | Commit | Time | Lines of Rust | Tests | ADRs | Commits |
|---|---|---|---|---|---|---|
| last text | f1a7fbc | 3 Nov, 02:43 | 115,148 | 962 | 133 | 215 |
| today | efddf6e | 4 Nov, 03:18 | 117,084 | 978 | 134 | 244 |
Growth: +1,936 lines, +16 tests, +1 ADR. Little new code again; the P-256 assembly itself (1,509 lines) is vendored and is not in the line count.
A second real machine
Until now the project had one real server: a Contabo VPS with an AMD EPYC (x86_64, KVM), used for the performance comparison with Mosquitto. ARM64 had run only in QEMU, with hardware acceleration on a Mac and without it in CI. The new machine is a netcup VPS 500 ARM G12.5: a Neoverse N1 core at about 3 GHz, 2 vCPUs, 3.9 GiB of RAM, a 64 GiB virtio disk, QEMU/KVM with UEFI firmware, a virtio network card. Everything was driven through the provider's REST API with a command-line client: we upload the ISO, attach it as a virtual CD, switch the boot device, power-cycle.
What we did on it, in order:
- A snapshot of the original system first. An online snapshot is not possible with UEFI, so the server was switched off and an offline snapshot was taken.
- Install. The ISO's installer wrote the image to the disk (the 30-second countdown included, about 40 seconds in all) and powered the machine off by itself, as designed.
- Boot from the installed disk took about 35 seconds to a TLS handshake.
- A retained message survived a hard power cycle. We published it, cut the power through the API, booted again and read it back.
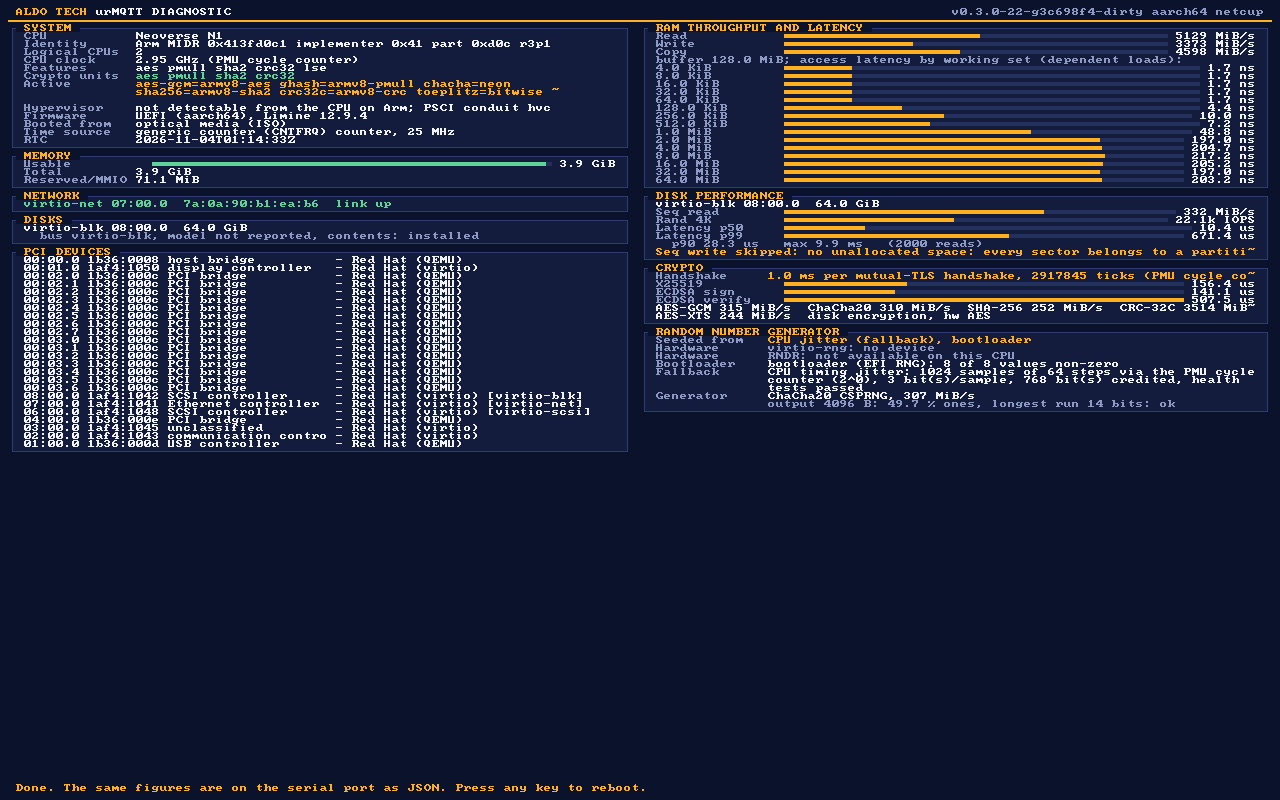
- The installed disk, measured by the Diagnostic entry (reads only; the write test was skipped because the installed layout leaves no unallocated space, which is intended): sequential read 332 MiB/s, random 4 KiB reads 22,147 per second with p50 10.4 µs, p90 28.3 µs, p99 671 µs, maximum 9.9 ms (2,000 reads).
Five items are not a test suite: this is one machine, one run of each, and the install path was exercised once on the real disk. What it does show is that the kernel's own virtio-blk driver, the installer and the boot work on a real cloud guest and not only in a laboratory emulator.
No screen, so the diagnostic goes over the network
The Diagnostic entry from v0.3.0 draws its figures on the framebuffer. On this server the provider's console says "Display output is not active": the virtual machine has a virtio graphics card for which we have no driver, and the serial port is not exposed. The figures existed and nobody could read them.
The fix is a boot word, diag-serve: the machine runs the same measurements, then boots as a normal live broker and publishes the report as one JSON document in the retained message $SYS/diag/report, which only an operator certificate may read. A small tool, urmqtt-diag-png, draws the dashboard from that JSON with the same code the kernel uses on the screen (the same layout and the same 8x8 font), so the picture is the screen the machine would have shown:
Two things were added to the screen on the way, because we missed them: the CPU clock (the PMU cycle counter against the time base: 2.95 to 2.98 GHz here; where only a fixed-rate timer is readable, it says "not measurable" instead of printing the timer's frequency as the CPU's) and a panel for the random number generator.
What the random number generator is made of
The panel states where the generator was seeded from and tests fresh bytes from every hardware source. On this machine it says:
- virtio-rng: no device.
RNDR(the CPU's own instruction): not available on this CPU. - The bootloader's EFI random number generator: 8 of 8 values non-zero.
- The CPU-timing-jitter fallback (ADR-038): 1,024 samples of 64 steps through the PMU cycle counter, 3 bits per sample estimated, 768 bits credited (one quarter of the estimate, by design), health tests passed.
- The generator's output, a sanity test over 4,096 bytes: 49.6 % ones, the longest run 16 bits. That is a check that nothing is stuck or biased, not a statistical certification.
So the generator on this server rests on the jitter fallback and on what the firmware handed over. That is exactly what ADR-038 describes, and it is the weakest seeding the kernel accepts. We do not call it broken: the credited bits are above the threshold the kernel demands (256), and the estimator is conservative. We also cannot prove it is as good as a hardware source. Whether a production image should refuse to boot without a hardware source unless the operator opts in is an open question for the owner (it is in the roadmap, below). In practice it is a question for the provider too: a hardware random number device for the virtual machine would settle it.
A handshake that was too slow
The Diagnostic entry also showed what a full mutual-TLS handshake costs on the server: 1.08 ms. Almost all of it is public-key arithmetic: two ECDSA P-256 verifications (the client certificate and the client's proof), about 508 µs each, X25519 176 µs, one ECDSA signature 141 µs. On x86_64 we had solved this earlier (ADR-130, the OpenSSL/Intel assembly: P-256 three to four times faster); on ARM64 the portable RustCrypto code was still running.
We did the same for ARM64 (ADR-255). The assembly is OpenSSL's ARMv8 nistz256 (Apache-2.0), taken from ring 0.17.14 and vendored with its provenance and every mechanical change written down. What mattered in the details:
- Integer-only. The assembly uses no NEON registers. The two table-selection functions upstream does use NEON, so we dropped them and wrote constant-time masked scans in Rust (they cost at most 1.4 µs of a 12 µs signature).
- Branch protection. The kernel is compiled with BTI and pointer authentication. Every one of the 8 exported entry points has a landing pad, checked in the kernel's disassembly, and the six that save the link register sign it.
- Tests, because this is cryptography in the trusted base. All of the x86_64 suite now also runs on aarch64 Linux: field and scalar arithmetic against a schoolbook reference, the whole generator table (2,368 entries) against RustCrypto, signatures bit for bit equal to RustCrypto's, verification verdicts, ECDH with off-curve and zero inputs, and the known-answer tests that run at every boot through the production paths. In a four-core virtual machine under an interrupt storm, 59,526 known-answer rounds ran with 0 mismatches.
- A timing test with a control, and a signal that was our own test. A deliberately leaky multiplication scores |t| of 482 to 1,755, so the test can see a leak at this scale. On an Apple core in a container ECDH scored 0.2 to 2.1, signing 0.5 to 1.9, key generation 0.8 to 5.5. On the arm64 server core of the CI runner, ECDSA signing scored |t| = 8.6, 9.1 and 8.3 in three attempts, over our bound of 7, while ECDH (3.9) and key generation (1.9) passed on the same machine. A result that repeats is not noise, so we wrote it down as an open finding (A255-W1) and, for a few hours, raised the bound for that one case to 12 so the build could pass. Then we found the cause, and it was the harness: the case signed one fixed message, so the sparse key produced the same signature every time and the random keys a different one each time, and DER-encoding a repeated signature is faster (|t| = 49 to 57 for the encoding alone). With a random message per measurement in both classes the case scores 1.4 and 1.8 on the runner (a Neoverse N2 virtual machine), the nonce generation alone 2.7 and 1.1, and the bound is back at 7. One thing stays open (A255-W2): the processor flag that makes multiplier timing data-independent on Arm cores (DIT) is set nowhere, neither by the kernel nor around the host-side calls. No measurement shows a difference, but the runner's virtual machine does not expose the feature, so the test could not show it either.
What it gained
First, the microbenchmark on the machine where we developed it, an Apple M4 Pro (not the target CPU, so the ratios on the server may differ), the same code the handshake calls, before and after:
| Operation | before (µs) | after (µs) | ratio |
|---|---|---|---|
| key generation | 30.8 | 7.0 | 4.4x |
| ECDH P-256 | 135.2 | 25.0 | 5.4x |
| ECDSA sign | 34.7 | 11.6 | 3.0x |
| ECDSA verify (unknown key) | 147.4 | 29.1 | 5.1x |
| CA verify (registered issuer) | 54.2 | 9.6 | 5.6x |
| X25519 (unchanged code) | 20.4 | 20.1 | 1.0x |
| handshake estimate (sum of the above) | 292 | 104 | 2.8x |
Then the real thing: the same load generator, the same method as in the earlier performance text (full TLS 1.3 handshake with a client certificate, no resumption, MQTT CONNECT, the server closes first), run from a machine 9 ms from the server, against the same netcup VPS, before and after the change. The benchmark image has the handshake limits relaxed, as in the x86_64 comparison; three repetitions, the figure is the median.
| Threads | before (conn/s) | after (conn/s) | ratio | errors |
|---|---|---|---|---|
| 32 | 848 (408-855) | 1,317 (957-1,317) | 1.55x | 0 |
| 64 | 827 (815-839) | 1,398 (1,352-1,416) | 1.69x | 0 |
| 128 | 778 (714-788) | 1,316 (1,313-1,383) | 1.69x | 0 |
| TLS part of a connection, p50, 32 threads | 18.5 ms | 13 ms |
Full handshakes per second rose by about 1.55 to 1.7 times, not the three times that the arithmetic alone would give. The reason is simple and worth saying: we accelerated P-256, and X25519 (176 µs), the TCP/IP stack, the record layer and MQTT are unchanged, so the fraction that remains grows in importance (Amdahl's law). The next candidate is X25519.
For orientation next to the x86_64 server of the earlier text. These are not comparable as a race: different CPUs, a different number of cores (4 against 2), a different distance to the generator (15 ms against 9 ms) and in both cases a shared load host that stole 5 to 60 % of its own CPU during the runs. The comparable column is the server's own CPU cost per handshake:
| Contabo, x86_64 EPYC (asm) | netcup, ARM64 N1 before | netcup, ARM64 N1 after | |
|---|---|---|---|
| server CPU per handshake | 0.26 ms (the broker's console) | 1.08 ms (Diagnostic) | 0.55 ms (Diagnostic, one run, see below) |
| handshakes/s, 32 threads | 169 (bench) | 848 | 1,317 |
| handshakes/s, 64 threads | 278 (bench) | 827 | 1,398 |
| handshakes/s, 128 threads | 413 (bench) | 778 | 1,316 |
The same day the Diagnostic entry ran again on this machine, with the assembly (in a build that also contains the graphics driver described in the update at the end): the server's CPU cost of one mutual-TLS handshake was 553 µs against 1.08 ms before, 1.95 times less. ECDSA verification took 192 µs (508 µs before), signing 78 µs (141 µs), and X25519 209 µs (176 µs; that code is unchanged, and the CPU clock of this run was 2.58 GHz against 2.95 to 2.98 GHz in the earlier ones, so single figures on this shared machine move by tens of percent). It is one run, on a shared host. That the handshake rate rose 1.55 to 1.7 times while the server's own cost per handshake fell 1.95 times fits together: the remainder of a connection is the stack, the generator and the network. Run-to-run noise is visible in the raw files: each set of three has one outlier (408 before and 957 after at 32 threads), when the load host lost most of its CPU to other virtual machines. At 128 threads the generator, not the server, is at its limit on both machines.
The rest of the suite on this machine
The same suite as for the x86_64 server (throughput, latency, fan-out, idle connections) ran against the new build in full. There is no "before" for these rows: the run was stopped to build the assembly, so they are the state after the change, and the assembly does not touch these paths except for the handshakes that open the connections. One fact explains most of what follows: this virtual machine has two vCPUs. Core 0 does the network card, the dispatching and all the MQTT and TLS work, core 1 is the database core and was 2 to 3 % busy throughout. The x86_64 server had four vCPUs and two worker cores. Everything below is therefore single-core broker performance.
| Idle connections | 5,000 | 10,000 | 20,000 |
|---|---|---|---|
| connected | 5,000 of 5,000 in 4.3 s | 10,000 in 9.3 s | 20,000 in 21.2 s |
| kernel heap growth per connection | 0.34 KB | 0.41 KB | 0.43 KB |
| errors | 0 | 0 | 0 |
(0.50 to 0.66 KB per connection on the x86_64 server at the H7 commit. The heap figure is $SYS/broker/memory/used minus its value before the first connection.)
| Latency at a modest rate (8 pairs x 100 messages/s, 64 B) | p50 | p99 |
|---|---|---|
| QoS 0 | 4.0 ms | 6.9 ms |
| QoS 1 | 4.1 ms | 7.0 ms |
| Fan-out (1 publisher, 64 B) | delivered per second | p50 | p99 |
|---|---|---|---|
| 100 subscribers, QoS 0, 50 msg/s | 5,000 (all) | 5.9 ms | 8.6 ms |
| 100 subscribers, QoS 1, 50 msg/s | 5,000 (all) | 6.3 ms | 10.0 ms |
| 1,000 subscribers, QoS 0, 10 msg/s | 8,805 of 10,000 | 207 ms | 5.4 s |
| Flood, 16 pairs, publishers as fast as the broker takes it | published/s | delivered/s | p50 / p99 | connections lost |
|---|---|---|---|---|
| QoS 0, 64 B | 231,317 | 85,140 | 1.36 s / 2.8 s | 0 |
| QoS 0, 1 KiB | 62,110 | 25,506 | 336 ms / 873 ms | 0 |
| QoS 1, 64 B | 107,349 | 55,965 | 21 ms / 29 ms | 0 |
| QoS 1, 1 KiB | 51,369 | 25,054 | 47 ms / 60 ms | 0 |
| QoS 1, 64 B, 64 pairs | 130,462 | 69,411 | 69 ms / 87 ms | 0 |
How to read it. The latency at a modest rate is the broker's contribution plus one trip to the generator: the generator is nearer to this server than the one in the x86_64 comparison, so the two latency columns are not comparable. The QoS 0 flood shows the usual picture of an overloaded single core: the broker accepts 231,000 messages per second and delivers 85,000 (the rest is dropped by the back-pressure rules, which is what they are for) with latencies in seconds, and no connection was lost; on the x86_64 server the same kind of flood cost several connections per run to the 20 ms watchdog (ADR-221 changed how that budget is counted since). The 1,000-subscriber row has the same character as before, tails in seconds, partly the generator's own. The figures at the H7 commit on the x86_64 server are in the earlier text; we do not put them in one table with these, because the code between the two measurements changed in the data path (ADR-221 to ADR-224) and the machines differ in everything.
Mistakes we found ourselves
- The picture said "no disks found" and the disk was in the report. The first version of
urmqtt-diag-pngdid not read thedisksfield at all. The owner of the project looked at the image, said it looked wrong, and was right. Fixed, and a test now reads a disk back from the JSON. - We declared the installer finished too early. The server's state went to "off" twice: once at the end of the power cycle and once when the installer finished. Our script took the first for the second, detached the ISO and booted the old system, which then reported the old version number and made us look for a fault in the installer that was not there. The script now waits for a fresh boot first.
- Progress history was lost. An analysis for the roadmap found that the commit for milestone S6 had replaced
docs/PROGRESS.md(1,763 lines, milestones M0 to S5) with its own 26-line entry. It stayed unnoticed for days, although the README calls this file "the source of truth". It was restored from the history. - CI failed after the assembly, in two places. Three smoke tests had the size of the boot image written into them ("10 MiB"), which grew to 11 MiB with the larger kernel; they no longer assume the size. The other failure was the timing test described above: the first time it looked like noise on a shared runner, so we made the test repeat three times; it failed in all three attempts, which is how we learned it was a signal, and the signal turned out to be our own test (it signed the same message every time). We raised that one bound for a few hours, said so openly, and lowered it again once the cause was fixed.
- The documentation counts three boot words and the code has four (
diag-serve), and the milestone table in the README still shows the work of the last week as planned. Both are in the roadmap as items to fix.
A roadmap, with questions
For the first time there is a roadmap: about 40 items in three phases (v0.4 hardening and operation; protocol and network; scale-out, more clouds and bare metal), each with a reason taken from a document, an effort, a risk and a way to verify it, 16 questions that only the owner can answer, and a list of what is out of scope. A few things it says plainly: only MQTT 3.1.1 is supported, a QoS 2 publish closes the connection, there is no IPv6 (the provider hands out a /64), no WebSocket and no outbound connection from the broker, and there are no drivers for the network and storage devices of the large clouds.
What is still not proven
- The per-handshake CPU cost with the assembly was measured on the Neoverse core only once (553 µs against 1.08 ms before, at a lower clock, on a shared host); the 1.55 to 1.7 times comes from the full handshake rate, and the 3 to 5 times from an Apple core. The x86_64 side of the refactor (the code moved into its own file) was type-checked and built, but its unit tests were not run and the x86_64 kernel was not booted after it: the x86_64 suites are not in CI, they are run by hand on the Contabo VPS, and that has not been done yet for this change.
- Constant time: for P-256 key generation, ECDH and signing (the key and the nonce) the statistical test found no dependence on a sparse secret. It ran on an Apple core and on the CI runner (a Neoverse N2 virtual machine), not on the netcup Neoverse N1 core, and never with the DIT flag set on a server core (A255-W2, open: the kernel does not set it). It was not run for X25519 or Ed25519. A black-box test bounds only what it can resolve at its sample size.
- One server, one provider, one installation. Several results (install, a power cut) are a single run. Apart from the handshakes, the performance rows have no "before", and a two-vCPU machine gives the broker one data core.
- The random number generator on this server is seeded from jitter and from the firmware, as described above.
- The signing key is still a test key, the release images are development builds, and the translations of this text were written by AI and not checked by native speakers.
- No independent audit, no bare metal, no IOMMU.
What comes next
- X25519 in assembly for ARM64 (it is 176 µs of the remaining handshake), and repeating the per-handshake measurement on the Neoverse core more than once.
- A decision on the random number generator's default: refuse to boot without a hardware source unless the operator says otherwise, or keep the jitter fallback and say so loudly.
- The old list: a decision on D1, fuzzing of the PCI and virtio parsers, the key dialog on the builder page.
- From the roadmap, for the next release: a real signing key and production PKI, MQTT 5.0 and QoS 2.
The code is at github.com/zeljan-alduk/urMQTT; docs/PROGRESS.md remains the source of truth about what works, docs/PERFORMANCE.md about what was measured (section 10 has the assembly's figures), docs/AUDIT.md about what is not proven. Pre-alpha, as before; bug reports and security reports following SECURITY.md are welcome.
Update, 4 November, later the same day. Four things from the hours after we published this text.
- The missing figure. The Diagnostic entry ran again on the netcup server with the assembly and gave the number that is missing in the first table: 553 µs of server CPU per mutual-TLS handshake against 1.08 ms before (details under that table).
- The signing signal was our test. The cause of the timing signal described above was found and fixed in the harness (it signed the same message every time); the bound is back at 7. What stays open is that the DIT flag is set nowhere (A255-W2).
-
The screen problem is solved, and it is on
main. We wrote a driver for the virtio graphics card (2D only, ADR-256), switched by a configuration key that is baked into the image (console.virtio_gpu,offby default,autoandonneed configuration format 5). Withon, the provider's Screen tab shows the Diagnostic dashboard live on the netcup server, the same picture as above, including the last screen with "press any key". Its fuzz target found a real bug in the first version: a display-info answer four bytes shorter than the specification was accepted as valid (A256-W1); a real device always sends the whole answer, so the server was not affected, and the parser now rejects the short one. What we have not verified: that the dark display really came from the firmware resetting the card when it hands over to the kernel (likely, not confirmed), the interaction with Secure Boot, and x86_64 on a real machine (it ran only under emulation). A known limit (A256-W2): theautosetting cannot tell a live emulated framebuffer next to a virtio card from a dead one, so in that one configuration it takes the virtio card. The driver adds a parser of the hypervisor's answers to the kernel, which is why it is off unless the configuration asks for it. -
The release. All of this is in v0.4.0, published the same evening as a pre-release (GitHub release). The builder page on this site offers it first; it needs configuration format 6, and the older templates (v0.2.0 to v0.3.0) refuse the new keys with a message that says to use a newer release. The limits of v0.3.0 stay: the signing key is still a test key, and the images are development builds with test certificates. CI on the release commit was green only after one job was run again (a client test inside a smoke scenario timed out once and passed the second time). What we checked on the published files: the minisign signature, the checksums, the build attestations of the kernel and of the SBOM, and the template with the new keys (v0.4.0 accepts them, v0.3.0 refuses them). The driver for the new virtio devices (console, balloon, input, vsock) is in the release but off by default and has not run on a real server.
Comments
Comment rules